
Stop Getting Lost in Large Codebases: I Built a Graph Viewer in VS Code
Visualizing Your Codebase: Building Codebase Viewer, a VS Code Extension
Why I built this ?
In a large codebase, it’s easy to lose track of relationships.
You open one file, then jump to another, then another. After 10 minutes, you forget:
- Who calls this function?
- What does it depend on?
- Where is this variable used?
- Which module is the real entry point?
Tools like "Find All References" are already available in Visual Studio Code, but the result is typically a flat list. It's useful, but it doesn't present the "big picture."
I therefore created Codebase Viewer, an extension for Visual Studio Code that creates interactive visual graphs from code relationships.
The problem with traditional navigation
When working with complex codebases:
- Find All References → gives a list, but not the structure
- Call stacks → show runtime only, not static design
- File explorer → shows folders/files, not connections
- Documentation → becomes outdated quickly
What I needed was visual context:
- “Where does this function sit in the system?”
- “Is this function a leaf node or a central dependency?”
- “If I refactor this, what breaks?”
What is Codebase Viewer?
Codebase Viewer is a VS Code extension that creates interactive relationship graphs from the symbol under your cursor (function/class/variable).
When you run the command, you can see:
- Call graphs: who calls this function + what it calls
- Reference maps: where the symbol is used across the codebase
- Clickable navigation: click a node → jump to definition
- Interactive exploration: zoom, pan, search nodes
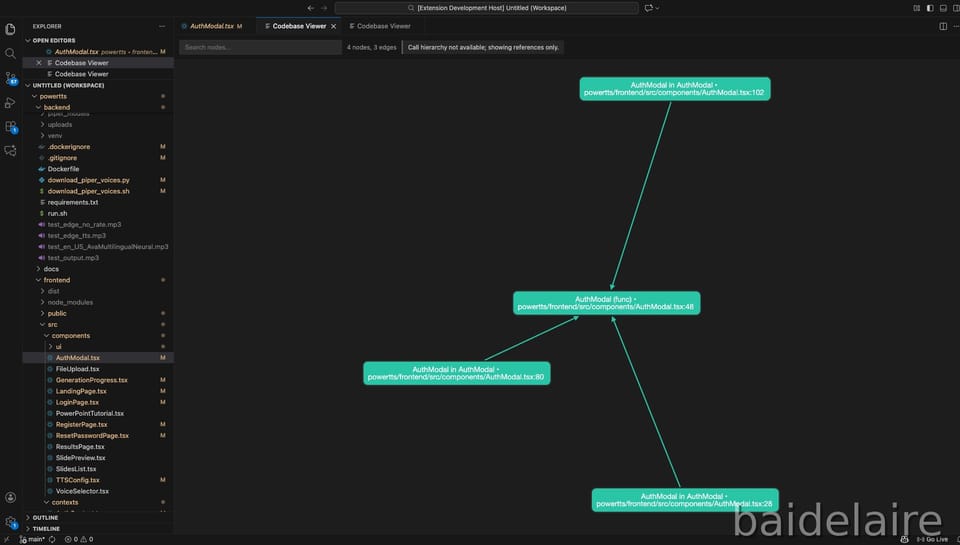
Here is sample walkthrough of the codebase viewer:
Key features
1) Multi-language support (with graceful fallback)
Different languages have different Language Server capabilities, so the extension adapts:
- TypeScript/JavaScript
- Strong support via built-in TypeScript language server
- Works well with Call Hierarchy
- Python
- Best-effort via Pylance / Python language server
- PHP
- Best-effort via Intelephense / PHP language server
If Call Hierarchy is not available, Codebase Viewer falls back to References Graph.
That means it still provides value even when the language server is limited
2) Smart graph building (two approaches)
The extension builds graphs using two methods:
A. Call Hierarchy API (primary)
- Builds caller ↔ callee relationships
- Best for understanding the “flow” of execution
B. References API (fallback)
- Shows where symbols are used
- Still useful to understand coupling and impact
This dual approach makes the extension practical across many projects.
Real-world use cases
1) Understanding legacy code
- Find entry points
- Understand dependencies
- See the “shape” of the system quickly
2) Refactoring safely
- See all callers before changing a function
- Identify impact radius
- Detect high-coupling components
3) Debugging faster
- Visualize the call chain around suspicious code
- Jump between related functions quickly
4) Code reviews
- Understand how new code connects
- Spot unexpected coupling or design issues early
Conclusion
Codebase Viewer helps you understand complex systems by showing relationships visually, not just lists.
If you are debugging, refactoring, onboarding, or reviewing code, the graph view gives immediate context that normal navigation doesn’t.